creating dynamic classification trees in r using dplyr, rpart & shiny
The following R Markdown code block will produce an R Markdown html document the app on Shiny with an embedded Shiny app that allows the user to chose any combination of attributes from a dataset and immediately see the resulting tree plotted using the rpart.plot package.
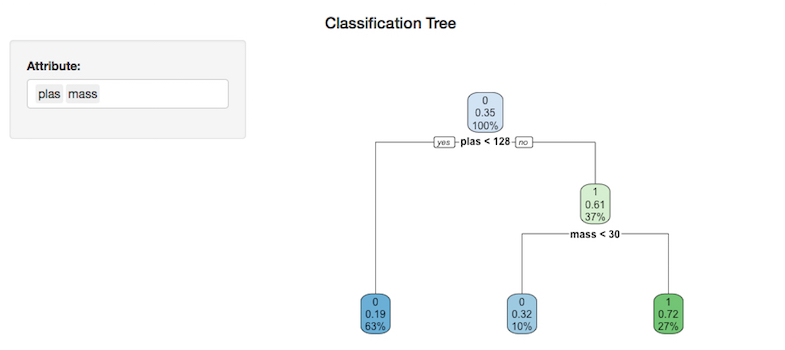
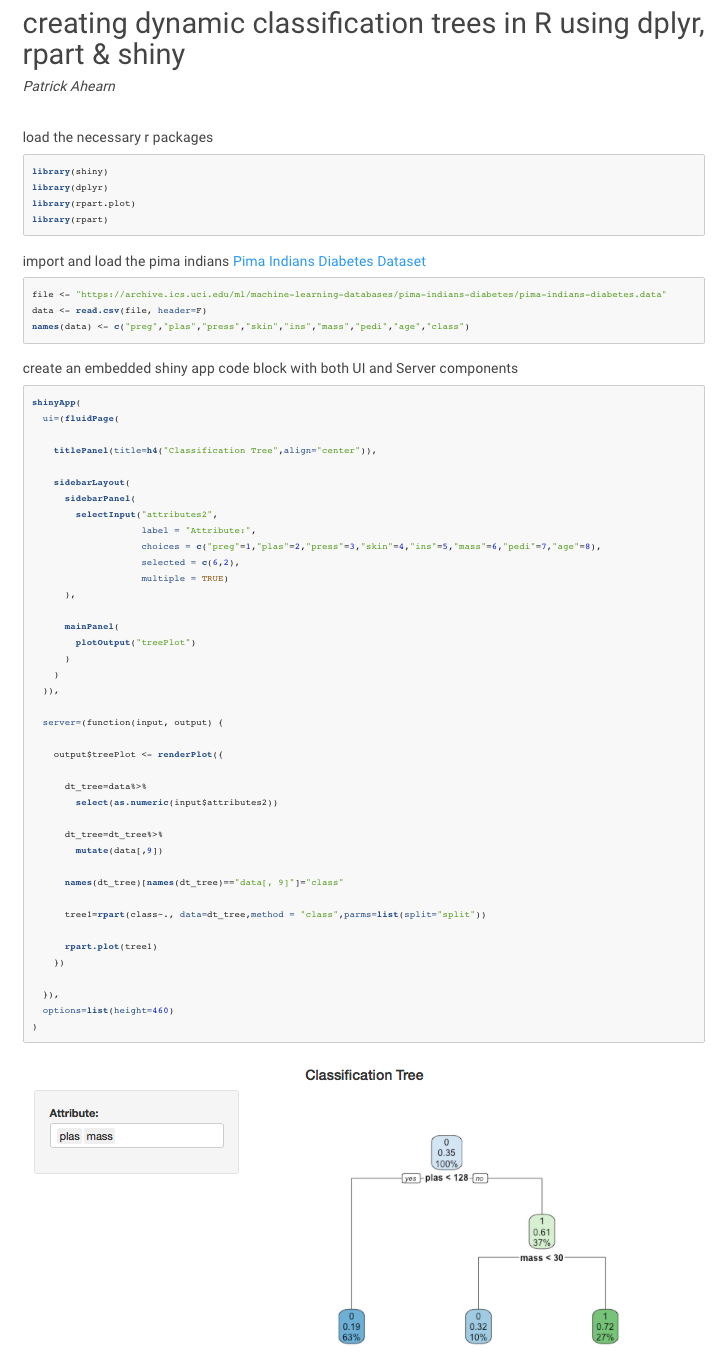
Once loaded, the default application will generate an rpart tree diagram using the attributes “plas” & “mass” from the pima indians Pima Indians Diabetes Dataset and look like this:
Different attributes can be utilized by selecting / de-selecting them in the attribute input box to the left of the plot. In the graphic below, the tree has been automatically redrawn using the selected attributes: “plas”, “mass”, “skin”, “press” & “preg”.
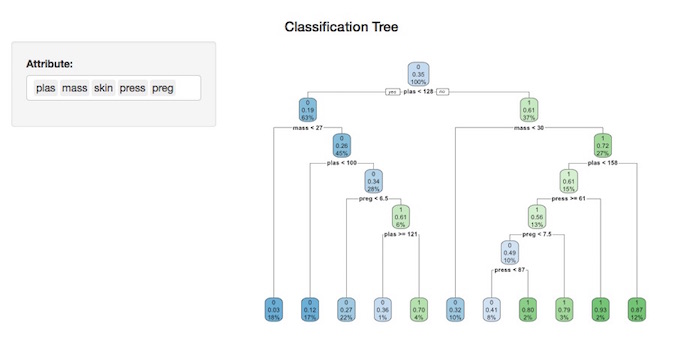
Note that not all attributes will force the underlying CART algorithm to generate a new split.
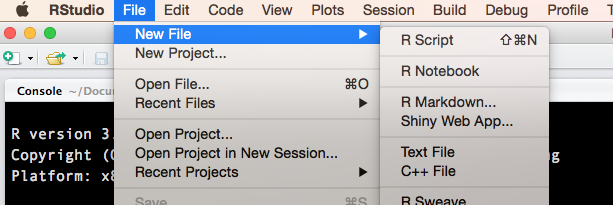
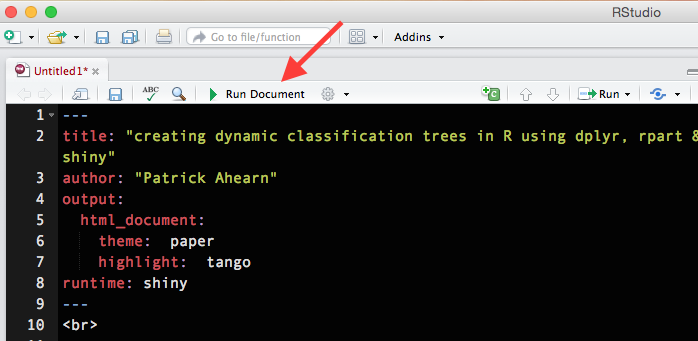
To reproduce this application, open a new R Markdown document in RStudio:
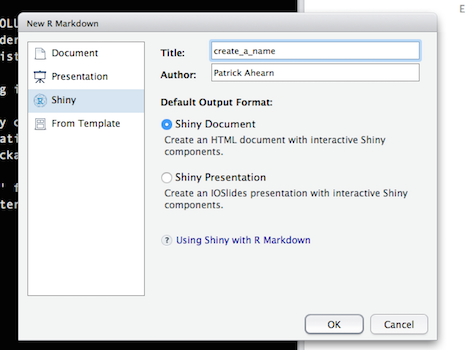
Select “Shiny” from the options on the left, create a title for your document and select “OK”:
Clear all the contents from the file that opens and copy the entire code block (included at the bottom of this post) below into the blank R Markdown document and save the file. Note the file exension should be .Rmd. Select “Run Document”:
An R Markdown document with comments, code and the embedded Shiny classification tree app should launch:
Enjoy!
---
title: "creating dynamic classification trees in R using dplyr, rpart & shiny"
author: "Patrick Ahearn"
output:
  html_document:
    theme:  paper
    highlight:  tango
runtime: shiny
---
<br>

####load the necessary r packages

```{r,echo=TRUE,message=FALSE}
library(shiny)
library(dplyr)
library(rpart.plot)
library(rpart)
```
####import and load the pima indians <a href="https://archive.ics.uci.edu/ml/datasets/Pima+Indians+Diabetes" target="_blank">Pima Indians Diabetes Dataset</a>
```{r}
file <- "https://archive.ics.uci.edu/ml/machine-learning-databases/pima-indians-diabetes/pima-indians-diabetes.data"
data <- read.csv(file, header=F)
names(data) <- c("preg","plas","press","skin","ins","mass","pedi","age","class")
```
####create an embedded shiny app code block with both UI and Server components
```{r}
shinyApp(
  ui=(fluidPage(

    titlePanel(title=h4("Classification Tree",align="center")),

    sidebarLayout(
      sidebarPanel(
        selectInput("attributes2",
                    label = "Attribute:",
                    choices = c("preg"=1,"plas"=2,"press"=3,"skin"=4,"ins"=5,"mass"=6,"pedi"=7,"age"=8),
                    selected = c(6,2),
                    multiple = TRUE)
      ),

      mainPanel(
        plotOutput("treePlot")
      )
    )
  )),

  server=(function(input, output) {

    output$treePlot <- renderPlot({

      dt_tree=data%>%
        select(as.numeric(input$attributes2))

      dt_tree=dt_tree%>%
        mutate(data[,9])

      names(dt_tree)[names(dt_tree)=="data[, 9]"]="class"

      tree1=rpart(class~., data=dt_tree,method = "class",parms=list(split="split"))

      rpart.plot(tree1)
    })

  }),
  options=list(height=460)
)
```

*data source: Lichman, M. (2013). UCI Machine Learning Repository [http://archive.ics.uci.edu/ml]. Irvine, CA: University of California, School of Information and Computer Science*
int main(int argc, char const *argv[])